Mauritius’s Textile Industry: Challenges and Export Opportunities
Mauritius, a small island nation with a population of 1.3 million, has emerged as one of Africa’s most successful and competitive economies. As per the World Bank, in 2021, its Gross Domestic Product (GDP) reached $11.5 billion, with a per capita GDP of $9,106. Real GDP growth was recorded at 3.7 per cent, with projections of 5.8 per cent in 2022 and 6 per cent in 2023, before a forecasted slowdown to 3.9 per cent in 2024 due to global economic uncertainties.
Ranked as one of Africa’s freest and most business-friendly economies, Mauritius was first in Sub-Saharan Africa and 30th globally in the 2022 Index of Economic Freedom. The country also topped the Global Innovation Index for Sub-Saharan Africa in 2021, reflecting its dynamic, innovation-driven business environment.
Mauritius benefits from strategic trade agreements that bolster its international trade presence, particularly in textiles. Agreements like the African Growth and Opportunity Act (AGOA) with the United States and the Economic Partnership Agreement (EPA) with Europe provide preferential market access for Mauritian exports, enhancing its competitive edge. Additionally, Mauritius leverages its membership in the Common Market for Eastern and Southern Africa (COMESA) to access reduced tariffs and improved trade conditions across the region, tapping into a larger consumer base beyond traditional markets in Europe and the US.
These trade agreements collectively strengthen Mauritius’ position as a key player in global trade, enabling the growth of its textile, manufacturing, and export-driven sectors. They help reduce export costs, promote regional and international market diversification, and attract foreign investment into Mauritius’ key industries.
Key Aspects of the Mauritian Industry
The key sectors driving the Mauritian economy include textiles, tourism, financial and business services, information and communication technology (ICT), seafood processing, real estate development, energy, and education/training. Mauritius also claims an Exclusive Economic Zone (EEZ) of 2.3 million square kilometres, though its undisputed EEZ covers around 1.3 million square kilometres. In addition, the country co-manages approximately 388,000 square kilometres of the continental shelf with Seychelles. Many Mauritian textile firms have adopted sustainable practices to meet the rising global demand for ethical fashion. Factories are investing in green technologies, such as energy-efficient equipment, water recycling, and reduced waste production.
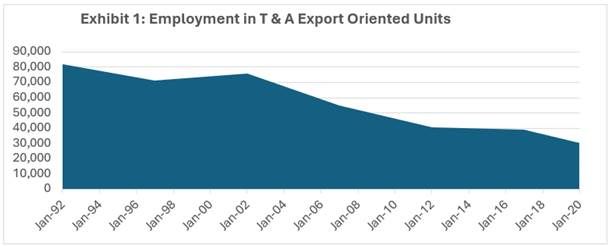
As per Statistics Mauritius 2020, employment in export-oriented firms has been consistently declining over the years. Meanwhile, the Mauritian government sees the ocean economy as a key driver of future economic growth. To advance this vision, it provides incentives for investment in emerging sectors like aquaculture, maritime services, marine biotechnology, and oil and gas exploration.
Production, Specialisation, and Export Dynamics
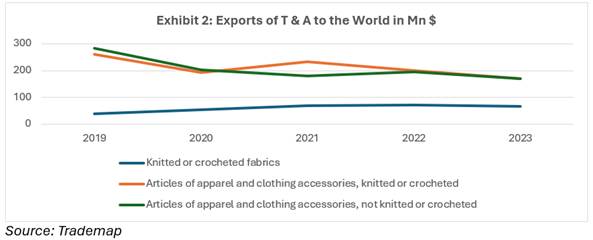
European and Asian investments have been instrumental in the development and expansion of Mauritius’ textile and garment industry. Mauritius has earned a global reputation for producing high-quality textiles, specialising in a range of products such as knitwear, woven garments, denim, shirts, and sportswear. The country’s textile industry is known for its commitment to delivering premium products that cater to both luxury and mid-market segments. This focus on quality craftsmanship has enabled Mauritius to establish a strong foothold in international markets, supplying some of the world’s leading fashion brands. The main products of exports are knitted or crocheted fabrics, articles of apparel and clothing accessories (knitted or crocheted), and articles of apparel and clothing accessories (not knitted or crocheted).
Knitted or Crocheted Fabrics (HS Code 60)
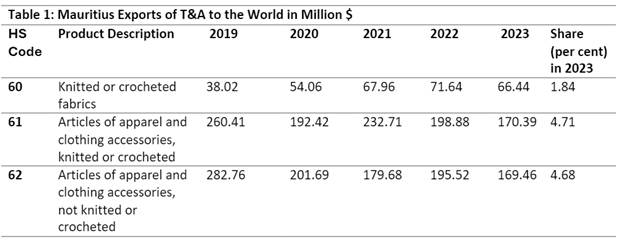
The export of knitted or crocheted fabrics has steadily increased between 2019 and 2022, with a peak in 2022 at $71.64 million. However, a slight decline can be seen in 2023, when it dropped to $66.44 million. Despite this increase, knitted or crocheted fabrics hold only 1.84 per cent of the total trade, suggesting that they contribute a relatively small but important segment of the overall textile trade.
Articles of Apparel and Clothing Accessories, Knitted or Crocheted (HS Code 61)
This category shows a noticeable fluctuation, with the highest value in 2019 at $260.41 million, followed by a significant dip in 2020 to $192.42 million, a slight recovery in 2021 at $232.71 million, and further decreases in 2022 and 2023. The decline from 2021 to 2023 could be attributed to several factors such as changing consumer preferences, increased competition from low-cost countries, or disruptions caused by global events (e.g., COVID-19). With a 4.71 per cent market share, knitted or crocheted apparel remains a significant contributor to Mauritius’s trade, although it has been facing challenges in recent years.
Articles of Apparel and Clothing Accessories, Not Knitted or Crocheted (HS Code 62)
Like the knitted apparel category, non-knitted or crocheted apparel experienced a consistent decline from $282.76 million in 2019 to $169.46 million in 2023. The drop in demand for non-knitted or crocheted apparel could reflect changing fashion trends, with consumers opting more for stretchable, knitted fabrics. The decline might also result from increased competition from Asian markets, which produce these goods at lower prices. The 4.68 per cent share for non-knitted apparel is slightly lower than the knitted segment, suggesting that both knitted and non-knitted apparel hold similar importance within Mauritius’s trade landscape, but they are both in a downward trend. Table 2 details the top export companies during 2019.

India’s Participation in Mauritius’s T&A Growth: Key Export Categories
Mauritius holds special significance for India due to strong historical, cultural, and political ties. Strategically located in the South-Western Indian Ocean, Mauritius has a population where 70 per cent are of Indian origin. The relationship between the two countries is unique, encompassing nearly all facets of bilateral and multilateral cooperation, grounded in shared kinship, culture, religion, and mutual interests. Since Mauritius gained independence in 1968, it has maintained close political ties with India.
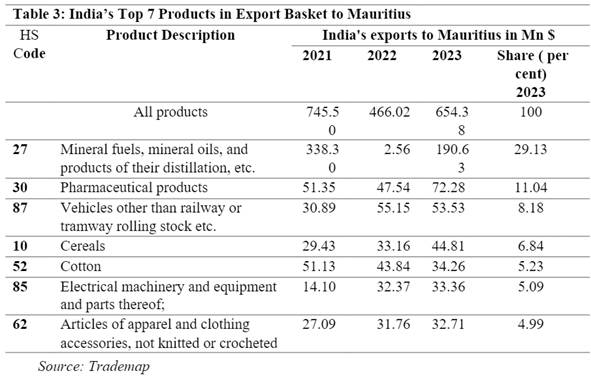
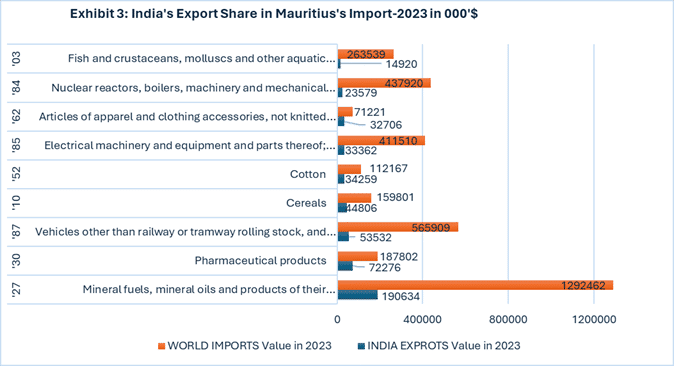
Mineral fuels, pharmaceutical products, and vehicles represent the largest export segments for India, with mineral fuels accounting for a significant portion of the total export share. The pharmaceutical sector’s growth aligns with India’s increasing role as a global supplier of affordable medicines and vaccines, especially in the wake of global health crisis. Apparel exports, particularly non-knitted apparel, maintain a stable position in India’s export portfolio, supported by strong manufacturing capacity and demand for textiles. Table 3 outlines seven top product categories exported from India with the respective export values and their market shares.
Mineral Fuels, Mineral Oils, etc. (HS Code 27).
India is a major exporter of refined petroleum products and mineral oils. The export value of mineral fuels and oils to Mauritius has dropped significantly from $338.31 million to $190.63 million, showing a major decline in recent years. The drop in exports could be attributed to global fluctuations in oil prices, changes in demand, and geopolitical factors that impacted the energy market.
Pharmaceutical Products (HS Code 30)
India is one of the world’s largest producers of generic pharmaceuticals, with its exports benefiting from increasing global demand for affordable medicines. The export of pharmaceutical products has seen fluctuations, growing from $51.35 million to $72.28 million in recent years, with a market share of 11.04 per cent. The rise in export value can also be linked to the global health crisis (COVID-19), which elevated demand for pharmaceuticals and medical supplies.
Vehicles Other Than Railway or Tramway (HS Code 87) and Electrical Machinery and Equipment (HS Code 85)
India’s automobile industry is well-regarded for its exports of two-wheelers, small cars, and commercial vehicles. Vehicle exports have experienced fluctuations but have stabilised around $53.53 million, capturing a market share of 8.18 per cent. This growth is likely driven by increasing demand and India’s cost-competitive manufacturing capabilities.
Cereals (HS Code 10)
In parallel, India is the largest exporter of rice, including both basmati and non-basmati varieties. Cereal exports, primarily consisting of rice and wheat, have surged from $29.43 million to $44.81 million, making up 6.84 per cent of the total export share. The rise in cereal exports can be attributed to the growing global demand for food security and agricultural products, bolstered by India’s extensive production base.
Cotton (HS Code 52)
India is a major producer and exporter of raw cotton, cotton yarn, and cotton textiles. However, cotton exports have dropped from $51.13 million to $34.26 million, driven by a decrease in demand due to lower production and exports of apparel, especially knitted and crocheted products. Despite this decline, cotton still holds a significant position, accounting for 5.23 per cent of India’s total export basket.
Articles of Apparel and Clothing Accessories, Not Knitted or Crocheted (HS Code 62)
India ranks among the largest apparel exporters globally, offering a wide range of products, including woven garments and accessories made from diverse textiles like cotton, polyester, and silk. Exports of non-knitted or crocheted apparel have shown consistent growth, rising from $27.09 million to $32.71 million, with a market share of 4.99 per cent. The sustained demand for Indian apparel is driven by developed markets such as the US and the EU, as well as emerging economies.
Exhibit 3 below illustrates the contribution of India's export share to the total imports of Mauritius from around the world in 2023.
Challenges
Mauritius, known for its high-quality textile production, faces challenges threatening its global competitiveness, including rising labour costs, supply chain disruptions, increased competition, and reliance on imported raw materials.
Rising Labour Costs
Economic development has led to higher wages, making it harder for Mauritius to compete with lower-cost production hubs like Bangladesh, Vietnam, and Ethiopia. To stay competitive, Mauritian manufacturers are focusing on automation, technology, and niche markets like luxury and eco-friendly apparel.
Supply Chain Disruptions & Competition
COVID-19 exposed vulnerabilities in Mauritius’ supply chains, causing delays and cost increases. Competitors like China, India, and African nations with larger, lower-cost workforces and closer proximity to raw materials pose additional challenges.
Dependence on Raw Materials
Mauritius imports most of its raw materials, increasing production costs and exposing manufacturers to price fluctuations in global markets.
The Way Forward
To tackle these challenges, the industry is pivoting towards innovation, automation, sustainability, and premium product segments. The government is actively enhancing trade agreements and infrastructure to improve supply chain integration.
Mauritius’s textile industry has evolved from a low-cost manufacturing hub into a high-value-added sector that prioritises quality, sustainability, and innovation. Despite facing obstacles like rising costs and intense global competition, Mauritius remains a significant player in the global apparel trade. Its strategic location and skilled workforce enable the country to maintain a competitive edge in producing high-quality, sustainable textiles for international markets.




Comments