


Sales and EBIDTA for the top Indian textile companies have dropped in Q1 FY21. Domestic demand is expected to pick up in the festive season ahead.
The covid-induced lockdown led to closure of factories, resulting in dropping utilisation and hence significant impact on sales and profitability, according to the Wazir Textiles Index (WTI) findings on the market performance of the sector for Q1 FY21.
The WTI, which assesses the cumulative financial performance of top Indian textiles companies, said that sales was calculated to be 56.4 in Q1 FY21 (Base year FY16=100), which decreased drastically by 57 per cent as compared to Q1 FY20. The WTI EBITDA was calculated to be 11.9 in Q1 FY21, showing a decline of 88 per cent from the value of 96.6 in Q1 FY20. The WTI Cost for raw material (RM), employee and other expenses were 57.8, 102.7 and 68.3, respectively in Q1 FY21,
Figure 1: WTI Sales, WTI Ebidta, WTI Cost
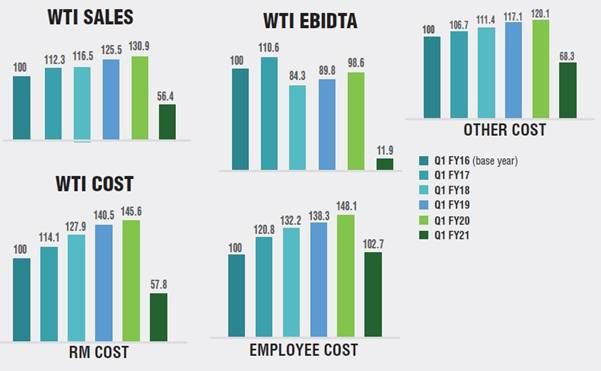
The consolidated sales of the select top 10 companies was ₹4,356 crore in Q1 FY21 as compared to ₹10,107 crore in Q1 FY20 and showed a decline of 57 per cent as compared to the previous year. As compared to Q1 FY20, average EBITDA margin has also declined by 9.4 percentage points in Q1 FY21 for the selected top companies. The average RM cost decreased by 4.3 percentage points, while the average employee cost increased by 6.6 percentage points in Q1 FY21 as compared to the same period during the previous financial year.
Overall financial performance of textiles sector
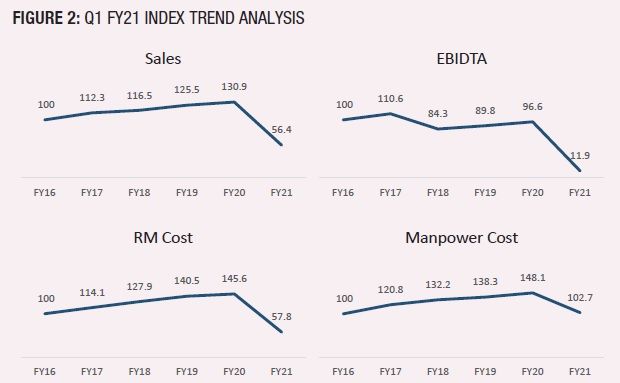
Due to the impact of worldwide lockdown induced by covid-19, there is a major decline in trend across all the indices. Figure 2 is a graphical depiction of the same.
India’s GDP shrinks a record 23.9%
India’s gross domestic product (GDP) stood at ₹26.9 lakh crore in Q1 FY21, as against ₹35.4 lakh crore in Q1 FY20, witnessing a record shrink of 23.9 per cent.
The average index of industrial production (IIP) for apparel decreased by 58 per cent in Q1 FY21 as compared to Q1 FY20, while that of textiles showed a major decline of 75 per cent. In Q1 FY21, the wholesale price index (WPI) for textiles decreased by 3 per cent in Q1 FY21 as compared to Q1 FY20, while that of apparel remained constant.
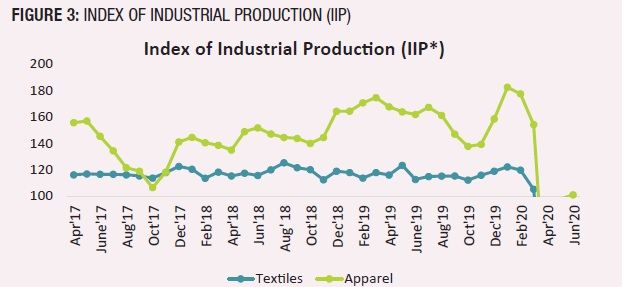
Data Source: Ministry of Statistics and Programme Implementation (Base Year 2011–12)
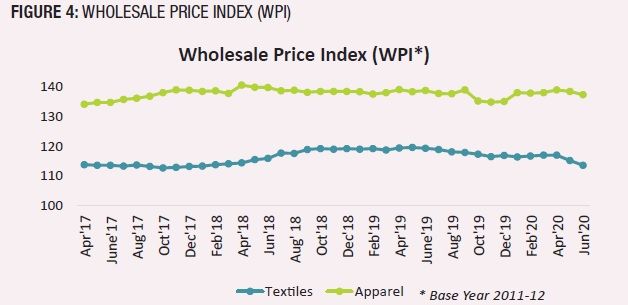
Data Source: Ministry of Statistics and Programme Implementation (Base Year 2011–12)
Source: DGCI&S
Source: DGCI&S
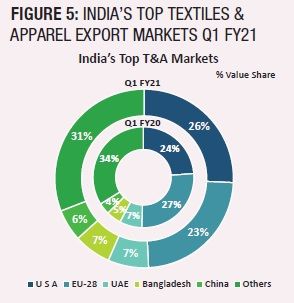
India lost more than half of the Textile and Apparel Exports in Q1 FY21
The textiles & apparel (T&A) exports in Q1 FY21 stood at 3.9 billion, showing a dip of 56 per cent from Q1 FY20. The exports of filament and apparel witnessed the highest dip of 67 per cent and 65 per cent, respectively. The US, EU-28 and the UAE remained the top export destinations for India’s T&A products with a combined share of 56 per cent.
Table 1: India's Textiles & Apparel Exports Q1 Fy21 (Values In Us$ Million)
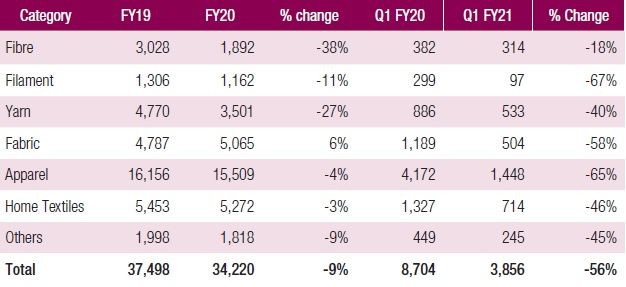
Source: DGCI&S
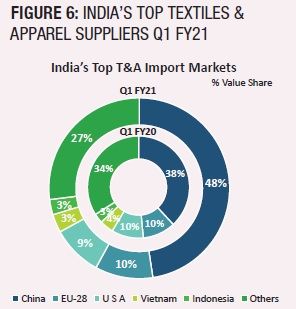
China’s imports to India increased by 10%
India’s T&A imports stood at $1 billion in Q1 FY21, recording a decline of 49 per cent over that in Q1 FY20. The imports of fibre and yarn experienced the highest decline of 63 per cent and 59 per cent, respectively. The imports of PPE kits and other related products are majorly from China which resulted in 10 per cent increase in China’s exports to India in Q1 FY21 as compared to Q1 FY20.
Table 2: India’s Textiles & Apparel Imports Q1 Fy21 (Values In Us$ Million)
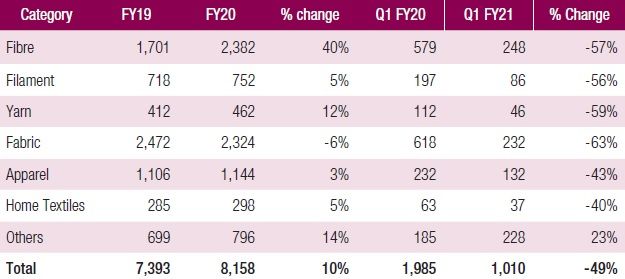
Source: DGCI&S
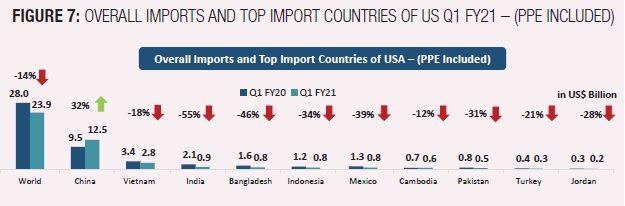
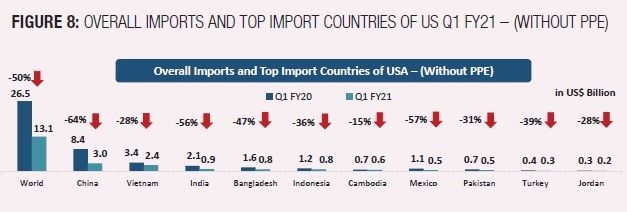
Imports of US declined by 50%
The US imported T&A products worth $23.9 billion in Q1 FY21, out of which $13 billion was PPE imports. Excluding PPE, the imports showed a decline of 50 per cent as compared to that in Q1 FY20. In YTD (Jan-Jul) analysis of US apparel imports, the country has shown a decline of 31 per cent in its imports whereas analysing the monthly imports from January to July, US apparel imports are on a recovery track after hitting the lowest in May.
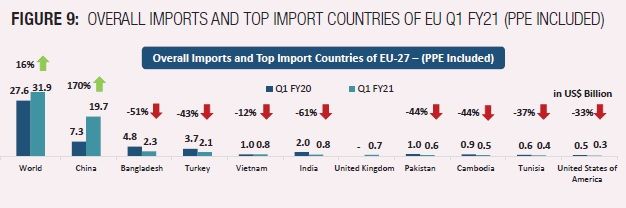
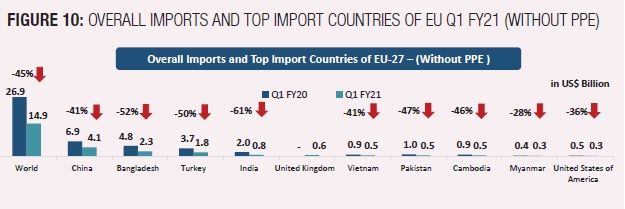
With a value of $31.9 billion in Q1 FY21, the overall T&A imports of EU increased by 16 per cent as compared to that in Q1 FY20. However, it includes $17 billion of PPE imports. Therefore, after excluding the PPE imports, the overall T&A imports of EU also showed a decline of 45 per cent in Q1 FY21 as compared to Q1 FY20.
Data Source: OTEXA
Data Source: OTEXA
Data Source: UN Comtrade
Data Source: UN Comtrade
Both the US and EU imported PPE kits and other related products mostly from China. In the US, 88 per cent of all PPE products have been sourced from China whereas in case of the EU, 93 per cent of all PPE products were sourced from China in Q1 FY21.
India’s exports to the US stood at $0.9 billion in Q1 FY21, showing a decline of 55 per cent as compared to the previous year. For the EU, India’s exports stood at $0.8 billion in Q1 FY21, showing a decrease of 61 per cent over the same period during previous year.
The Indian T&A industry showed a significant decline in terms of overall sales and EBIDTA levels in Q1 FY21. The performance and exports were already bleak but the economic lockdown due to covid-19 in March has further weakened the performance. However, towards the end of the quarter, exports picked up as demand is returning back in the US and EU. In the domestic market too, demand is expected to pick up in the festive season ahead. Hence, industry needs to accordingly gear up to tap the demand.
This article was first published in the October 2020 edition of the print magazine.


Comments