


A retailer does a lot of forward planning for sales, stocks, purchases and reduction amounts for a particular selling period to avoid the situation of dead stock. A Six Months Buy Plan, a flexible month-wise sales planning chart, can be used by the retail buyer and merchandiser to monitor monthly inventory sales and purchases in a better way. This article uses the ‘Stock to Sales Ratio’ (SSR) values to develop the buy plan.
Retailing is a challenging activity, and inventory planning is critical to it. The retailer must plan in advance the inventory that would sell during a particular season to achieve his financial goals. The inventory value may be expressed as inventory at cost (purchase value) and inventory at retail (sales value). Therefore, if the inventory does not get sold, the retailer has to sit on a stockpile. Such a scenario calls for immediate action and probing. It helps to decide on a future course of action and identification of the causes of deviation. Retailers generally plan the sales, stocks, purchases and reduction amounts much in advance for a particular selling period (February-July and August-January). This planning is done using a tool known as the Six Months Buy Plan or inventory plan, or dollar plan. It’s a flexible month-wise sales planning chart that can accommodate the changes occurring during the selling season. The retailer does not have control over external factors that may directly or indirectly affect retail sales. For example, the impact of policy changes, entry of new competitors into the market, introduction of new designs, celebrity influence, and the like. The buy plan can be devised using (a) Basic Stock Method and (b) Stock to Sales Ratio Method (SSR). This article uses the SSR values to develop the buy plan.
The Six Months Buy Plan
The Six Months Buy Plan is used to relate sales, inventory levels, purchases, and reductions. The buyer uses it as a merchandising/inventory tool to operate a more profitable retail business. It is a working document for monitoring and adjusting the monthly merchandising activities in the store or department. The plan helps the retail buyer and merchandiser to monitor monthly inventory sales and purchases. It also impacts other expenditure in the store, such as the promotional and visual merchandising budgets and operational activities. The components of Six Months Buy Plan have been discussed elaborately in the following sections.
Initial Markup
The initial markup (IMU) helps to determine the initial retail price of a product given its cost. It is calculated as a percentage of the retail value of the product.
Initial markup = Retail – COGS (cost of goods sold)
IMU% = (Retail – COGS) x 100 / Retail
COGS at retail is the retail value of the stocks purchased. It is the cost at which the goods are bought from the vendor. It includes the following:
COGS = billed cost or list cost or cost quoted by the vendor + freight charges (transportation cost + insurance) – cash discounts (1 per cent to 5 per cent) + alteration costs (or workroom cost) + warehouse cost + distribution cost.
IMU helps to maximiser sales and make a considerable profit while taking care of the operating expenses of the business for their day-to-day activities. Thus, a pre-determined retail value (written on the price tag) of a product is determined after careful analysis of several factors that affect the price (Maximum Retail Price or MRP). IMU takes into account all such determinants as detailed below.
Initial markup percentage = (Operating expenses + Net profit + Reductions + Alteration costs – Cash
discounts) / (Net sales + Reductions)
(Where, Reductions = Markdowns + Stock shortages + Discounts)
(The vendor gives cash discounts on the list price of the goods purchased. This may be due to several reasons like bulk buying, timely payment to the vendor, or long-term relationship with the vendor. The retailer earns a cash discount only after the total amount for the goods is paid).
The initial markup usually does not remain constant during a selling season. It fluctuates due to several reasons like markdowns, shortages, thefts and breakages, employee discounts, etc. Thus, the sales values are adjusted in the plan throughout the selling season to achieve the targeted sales value for the season. It is helpful to calculate the gross sales value.
Gross Sales = Net sales + Reductions
Net sales
The monthly sales value represents the sales target for each month and is calculated as a percentage of the net sales value for the season. The net sales are calculated as a percentage increase or decrease in the last year's sales (LYS):
This Year Sales (TYS) = LYS + [ (% Increase or Decrease) X LYS]
For example: TY planned sales = LYS + 20% of (LYS)
TY planned sales = LYS – 20% of (LYS)
The percentage increase or decrease depends on the sales forecast for the upcoming season. This forecast depends on the likely changes in customers' purchase patterns, change in fashion tastes and products, product selling prices, market fluctuations, and other external factors.
The sum of monthly sales gives the net sales value for a season. Thus, monthly sales can be determined as a percentage of net sales value taken as 100 per cent.
Reductions
Reductions in the retail sales value occur due to merchandise shortages/overages, markdowns (includes customer discounts and employee discounts), shrinkages (loss due to theft or damage), returns and refunds and corporate discounts. Reductions are always made from the Maximum Retail Price (MRP) of the products. Reductions are calculated as a percentage of net sales value.
Reduction % = $ Reductions x 100/ $Net Sales
Gross Margin
Net sales value help in determining the gross margin earned by a retailer. Gross margin helps in making strategic business decisions like business expansion, addition of new product lines, opening of new stores, recruitment of staff, staff salaries, marketing plans and other such strategies. It is determined by subtracting the COGS (cost of goods sold) at retail from the net sales at retail.
Net sales – COGS = Gross Margin
The operating expenses of a store are also a major component of gross margin earned. Once it is deducted from the gross margin value, the retailer arrives at the net margin value. Net margin or net profits determine the profitability of the business. Operating expenses include all expenses (direct and indirect) the retailer has to bear to carry out the business activities of each day. It includes salaries, wages, rents, utility bills, warehouse costs, transit costs, etc.
Gross Margin = Operating Expenses + Net Profits
(Where, Operating Expenses = Direct + Indirect expenses)
To achieve a considerable profit, the retailer has to manage the inventory levels to reduce the inventory holding cost, unsaleable items, older stocks, etc. Such monitoring of stocks can be done using the Six Months Buy Plan tool.
Monthly Inventory Levels
Inventory or stocks are needed to achieve sales planned. How much stock will help in achieving what volume of sales is given by the stock to sales ratio or SSR. It is determined by using stock and sales data of LY during the same period or industry data published for this year. Stock levels for a month vary directly according to the planned sales for that month. SSR helps to determine the BOM (opening or beginning of month) stock levels for each month.
Stock-sales ratio for a month = Opening Stock for the month (BOM) / Planned Sales for the month.
Inventory Purchase & Control
Monthly stocks are purchased from various vendors or suppliers at different points of time during a month. This activity ensures optimum stocks' availability for achieving planned sales and reductions for a month and carry forward additional stock to the next month.
Planned monthly inventory purchases @ retail = Sales + Reduction + EOM – BOM
Planned Purchases @ cost = Pl. Purchases @ retail X (1-IMU per cent)
Where, Sales + Reduction + EOM (End of month) = How much stock the retailer needs throughout a month.
And, BOM (Beginning of month) = How much stock the retailer has on the first day of a month.
The total sum of planned Purchases @ Cost for the given period provides the total investment a buyer has to do in inventory procurement from time to time. The buyer controls the distribution of funds over the purchases using OTB.
EOM and BOM Stock
Where EOM stock is the closing stock for a month. This stock is carried over as the opening stock of the next month. BOM stock is the stock in hand on the first day of a month.
This means that EOM of previous month = BOM of the current month.
and EOM of current month = BOM of the next month
Let us say, EOM of February = BOM of March
EOM of March = BOM of April and so on.
The beginning and end of month stock values help in calculating the average inventory or average stock value. This value determines the average stock level at any point in time during a selling period.
Thus, for a selling period of six months (n=6),
Avg. Inventory = (Sum of the BOM stock values of 6 months + the EOM stock value of the 6th month) / (6+1)
Open to Buy (OTB)
Inventory control is achieved through Open to Buy (OTB). It helps to have control over new purchases during a month. The Planned monthly inventory purchases value for a particular month indicates the sum available to purchase goods during that month. Still, this figure does not show the distribution of money throughout the month. Experienced buyers distribute purchases over the entire month by determining the amount of unspent funds available to make any new purchases within a month. Thus,
OTB = Planned purchases for the month – Orders in transit to be delivered in that month
• This budget (OTB) helps to
• Reorder or replace fast-selling items.
• Fill in stocks so that complete stocks are offered.
• Compete well when buying special purchases and/or new and exciting items as they become available.
• Test offering of new items.
Example: Sales for January has started. On January 15, the infant’s wear section has an inventory of $27,000 and inventory on order amounts to $1000. The buyer is yet to receive the order within a week. For the rest of the month, the planned sales are $10,000, and markdown is $500. Stock planned for January 31 is $32,800. Determine the OTB at retail for the rest of the month.
Solution:
(a) Total inventory the retailer has till 15 January = $27,000
Inventory on order = $1000
Therefore, Stock at hand = $27,000 + $1000 = $28000
(b) Planned sales for the rest of the month = $10,000
Planned Markdown = $500
EOM stock = $32,800
Total stock value required for managing the rest of the month = $10,000 + $500 + $32,800 = $43,300
(c) Thus, OTB at retail for the rest of the month
= Stock required – Stock at hand = $43,300 - $28,000 = $15,300
Therefore, to achieve the planned sales target, the buyer must spend $15,300 in new purchases.
Inventory Turn or Stock Turn
Inventory Turn value or Stock Turn is a performance indicator calculated at the end of a selling period to analyze how the store or product category has performed, whether the retailer’s sales forecasts were accurate or not. It depends upon the net sales value and average inventory value.
Stock Turn or Turn = Net Sales / Average Inventory
Stock turnover is a measure of operational efficiency of the store. Specifically, it tells the retailer how many times the stock or inventory has been sold and purchased over a given period. A low turnover rate may point towards overstocking, product obsolescence, or deficiencies in the product line or marketing efforts.
Methods to increase Stock Turn
• Reduce the number of price lines carried
• Limit the number of brands carried
• Reduce duplicate styles
• Carry smaller reserve stocks
• Avoid accumulation of unsaleable goods
• Eliminate unsaleable goods
• Closely follow the buying plan and identify reasons of deviation if any.
How to create a Six Months Buy Plan?
Sample Template:
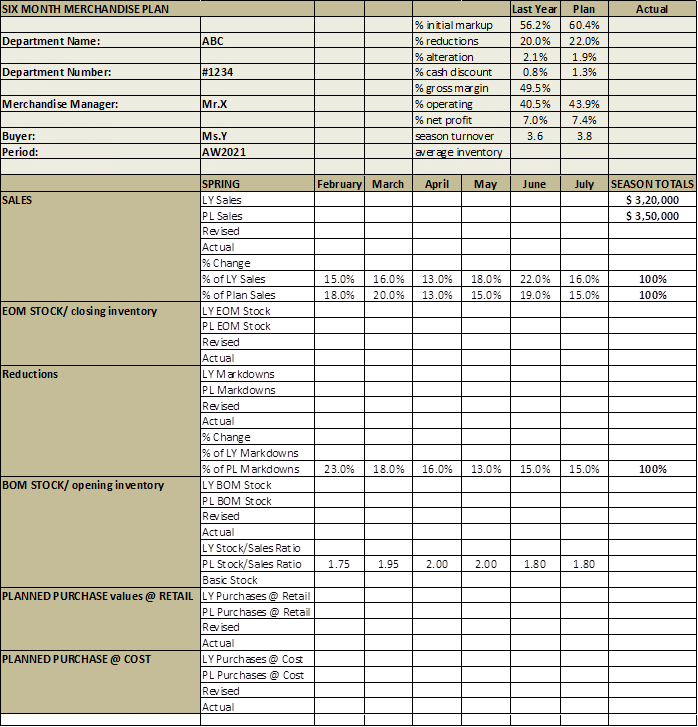
Step 1: Insert as much information provided into the 6-month plan.
Step 2: Calculate IMU per cent = (Expenses + Profit + Reductions - Cash Discounts) / (Net Sales + Reductions)
First convert the percentage figures in dollar value.
IMU per cent is the only value that is calculated over Gross sales (Gross sales % = Net sales % + Reductions % = 100 % + Reductions %)
Step 3: Use the percentage monthly planned sales to get the dollar amount.
Monthly Pl. Sales = % Pl. Sales X $ Net Sales
Step 4: Calculate each month’s Pl. Reduction amount.
Monthly Pl. Reductions = % Pl. Reductions X $ Net Sales
Step 5: Find BOM Stock figures for each month using the SSR method
SSR = BOM Stock for each month/ Monthly Pl. Sales
Therefore, BOM = SSR X Monthly Pl. Sales
SSR values are already provided in the above template.
Step 6: Find EOM Stock value for each month
EOM of February = BOM of March
EOM of July = Avg. Inventory or stock value for the season
Step 7: Avg. Inventory = Net Sales / Turn = 3,50,000/3.8 = 92,105
Step 8: Determine monthly Planned Purchases at Retail and Cost
Pl. Purchases @ retail = (Sales + EOM stock + Reductions) – BOM Stock
Pl. Purchases @ cost = Pl. Purchases @ retail X (1 - % IMU)
Questions: Find out
a) The monthly sales for LY.
b) Avg. Inv. for LY.
c) Total % change in net sales.
d) Total amount (at retail and at cost) needed by the buyer to make stock purchases for the given season.


Comments